As soon as your alpha invite is approved we’ll email you with details on how to get started with Linkr™.
OK, Thanks!Statistical Information
Statistical information about campaigns can be viewed in either through the Dashboard or the Campaign Statistics menu.
Dashboard
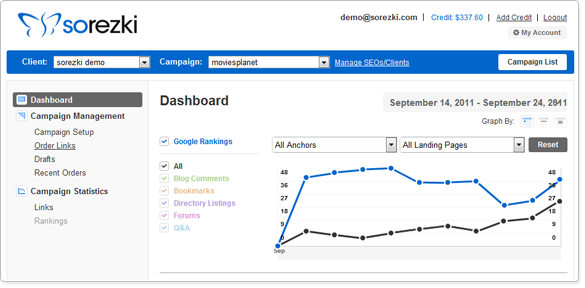
The Dashboard is the campaign’s main page where you can view general information about links as well as graphs which depict statistics about the campaign’s progress in Google’s search engine (Google Rankings). A Google Ranking is a number which tells you the placement of your URL (root domain or landing page) amongst the first 100 results returned by the Google search engine (the Search Engine Results Page, SERP) when your anchor(s) is searched for. The rankings are relevant only for the targeted country and targeted engine you defined for the campaign.
The information displayed in the Dashboard is relevant for the time frame selected in the date picker. Data about a link is tracked in the Dashboard as soon as the link is built (unless the campaign has a status of Idle or Suspended). There are three information displays in the Dashboard: a line graph, circle graphs and tables.
Line Graph
The Line Graph displays links’ Google Rankings statistics and is segmented by the different services (Blog Comments, Bookmarks, Directory Listings, Forums, Q&As).
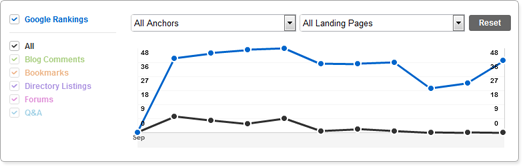
There are a few ways to manipulate the information displayed in the line graph:
-
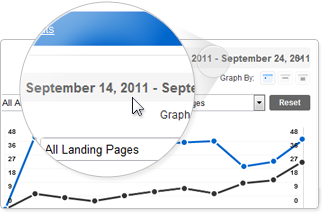
Date Picker
On the upper right side of all the pages under Dashboard and Campaign Statistics menu there is the Date Picker which displays a date range. To select a different time frame simply click on the Date Picker and select the date range you want from the calendars and the information displayed will change accordingly. The default date range displayed is always one month previous to today’s date. -
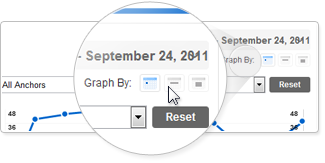
Graph By
Directly below the Date Picker is the Graph By option. You can select to view the graphed information by day, by week or by month. The default display is graphing by day. -
Check Boxes
Next to each service is a check box. Unchecking a box removes information about that service from the graph.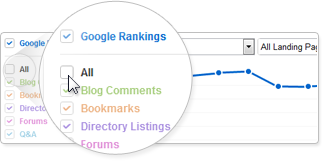
-
All Anchors & All Landing Pages Drop-Down Lists
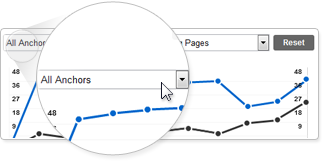 Select to view information about specific anchors, specific landing pages, unique anchor and landing page combinations or about all anchors and all landing pages.
Please Note: Statistical data is available only for those anchors and landing pages that were ordered in links.
Select to view information about specific anchors, specific landing pages, unique anchor and landing page combinations or about all anchors and all landing pages.
Please Note: Statistical data is available only for those anchors and landing pages that were ordered in links.
-
Circle Graph
Below the Line Graph are three circle graphs which display information about the quantity of links built in relation to TLD (top level domain), Page Rank and service type.
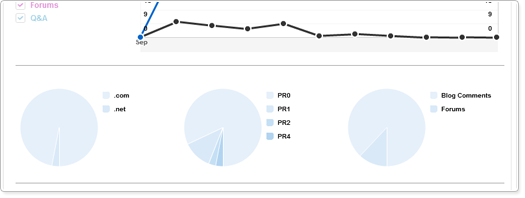
Please Note: Selecting or deselecting a service from the list to the left of the line graph will NOT impact the circle graphs. Selecting a specific Anchor and/or Landing Page from the drop down lists will impact the data displayed in the circle graphs.
Tables
Below the Circle Graphs are a series of tables. The tables display numerical data about the links created in regards to TLD, PR and service type within the time frame and anchors/landing pages selected.
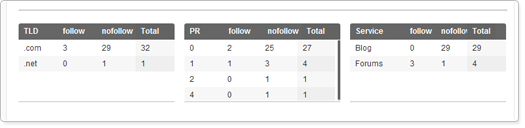
Please Note: Selecting or deselecting a service from the list to the left of the line graph will NOT affect the tables. Selecting a specific Anchor and/or Landing Page from the drop down lists will affect the data displayed in the tables.
Campaign Statistics
Linkr™ gives you detailed statistical reports about the links built for you. Reports are available once an order moves into the Completed Disputable phase and continue to be available during the Completed Locked phase. All reports are exportable as Excel files. All of the pages under the Campaign Statistics menu are governed by the Date Picker.
Links
The Links tab gives you a full list of the links created for the campaign (to see the links created for a specific order step into Order Links). In Links you will see a list of URLs which are the actual links built by the link builders. Clicking on a URL will take you to the webpage where the link is located so you can view its content. Clicking the Export button on the right side of the center of the page will transfer the information into a detailed Excel report.
Rankings
Coming soon!